If there is one challenge to renewable energy that ranks above all the others, it’s the intermittency of solar and wind. Merriam Webster defines intermittency as “coming and going at intervals; not continuous.” Because wind and sun aren’t always available or even predictable, keeping our lights on requires utilities to constantly fall back to “dispatchable” generation sources like nuclear, coal, and natural gas.
Several studies point to intermittency as the cause of rising electricity prices – are they right?
The impact of intermittency’s costs and challenges is fiercely debated among advocates and critics alike. In 2018, solar and wind only powered 8% of the US grid. But as this number inevitably grows, some experts are concerned that more of these intermittent renewables will make the grid too hard to manage and drive up the price of electricity. There are several widely-cited reports that analyze intermittency and suggest correlations between increased renewables and rising electricity prices.
- One author analyzed several US states between 2009 and 2017 and showed that electricity prices increased as more solar and wind were added to the states’ grids.
- A research team showed that states who passed policies mandating faster adoption of solar and wind (Renewable Portfolio Standards or RPSs) between 1990 and 2015 saw their electricity prices rise faster than states without those policies.
- And, many analysts point to Germany’s strong commitment to renewables (Energiewende) and the country’s subsequent 50% increase in residential electricity prices.
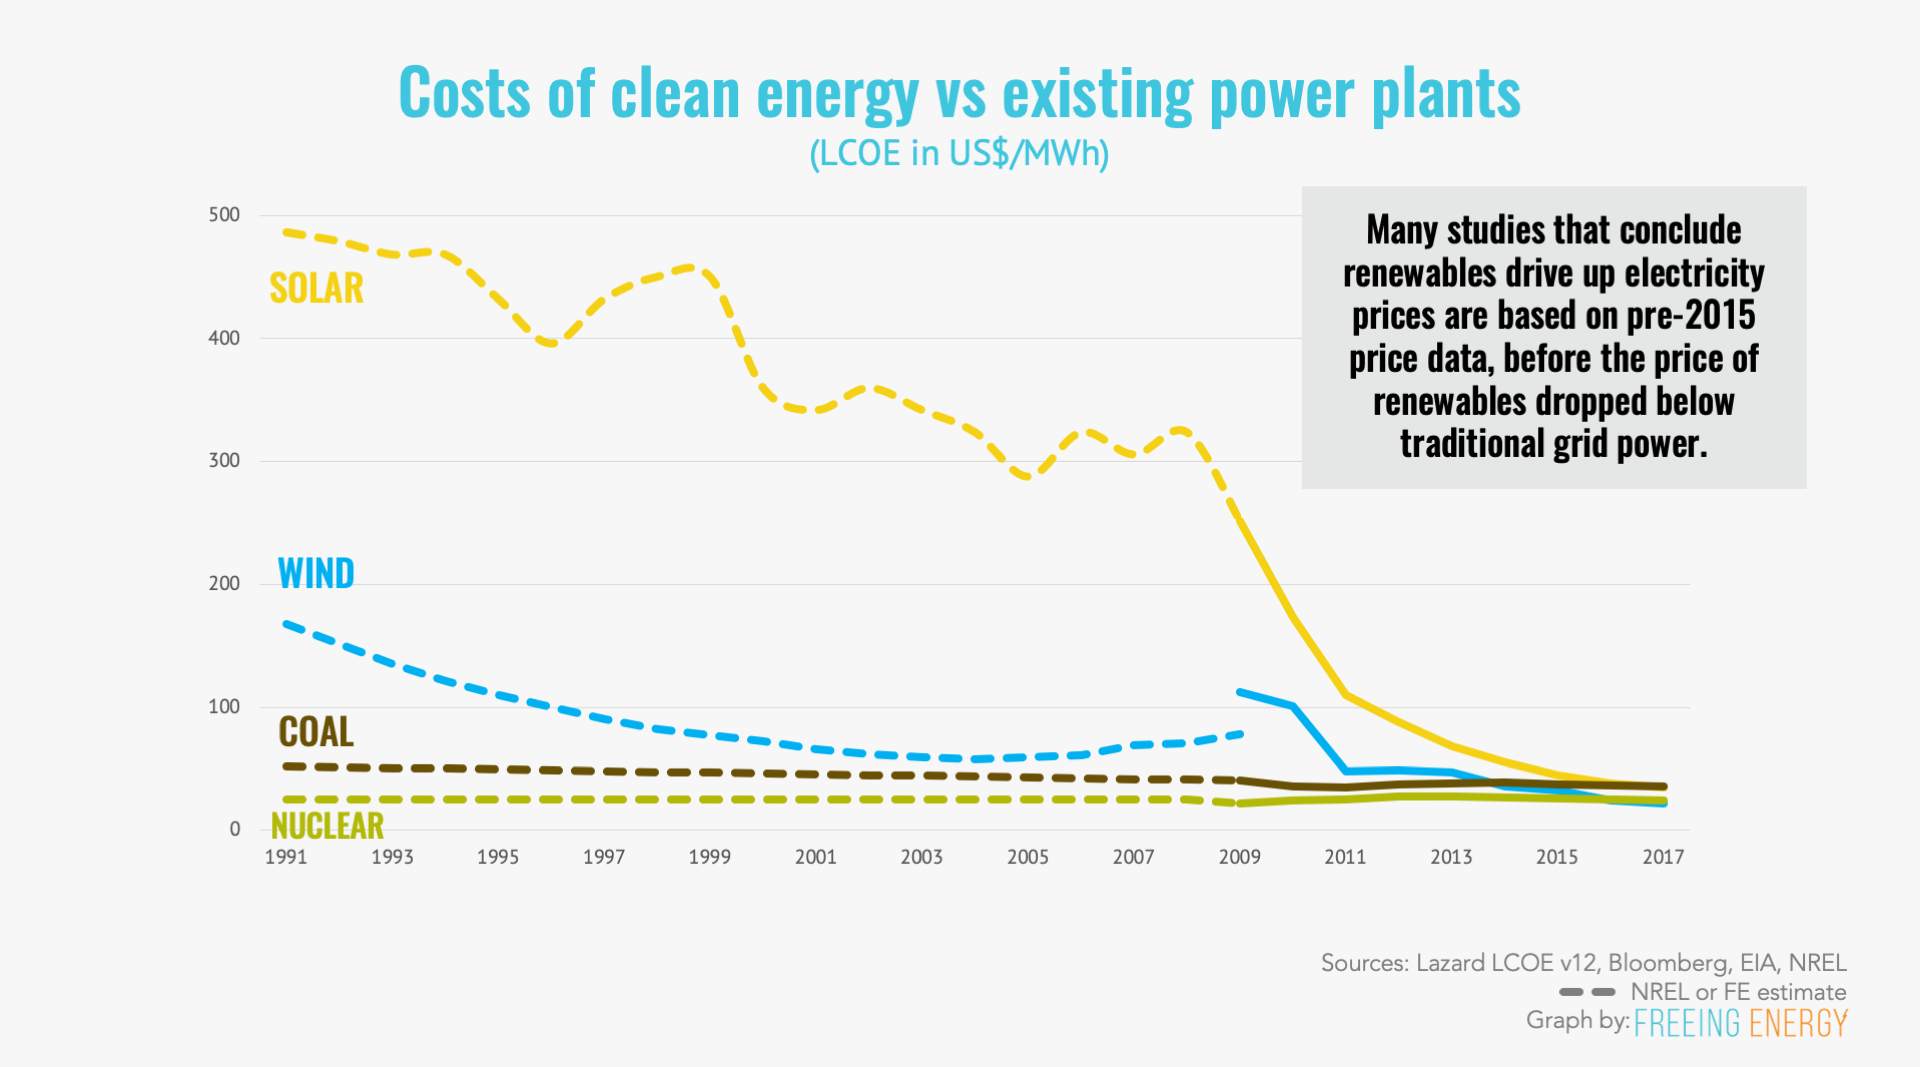
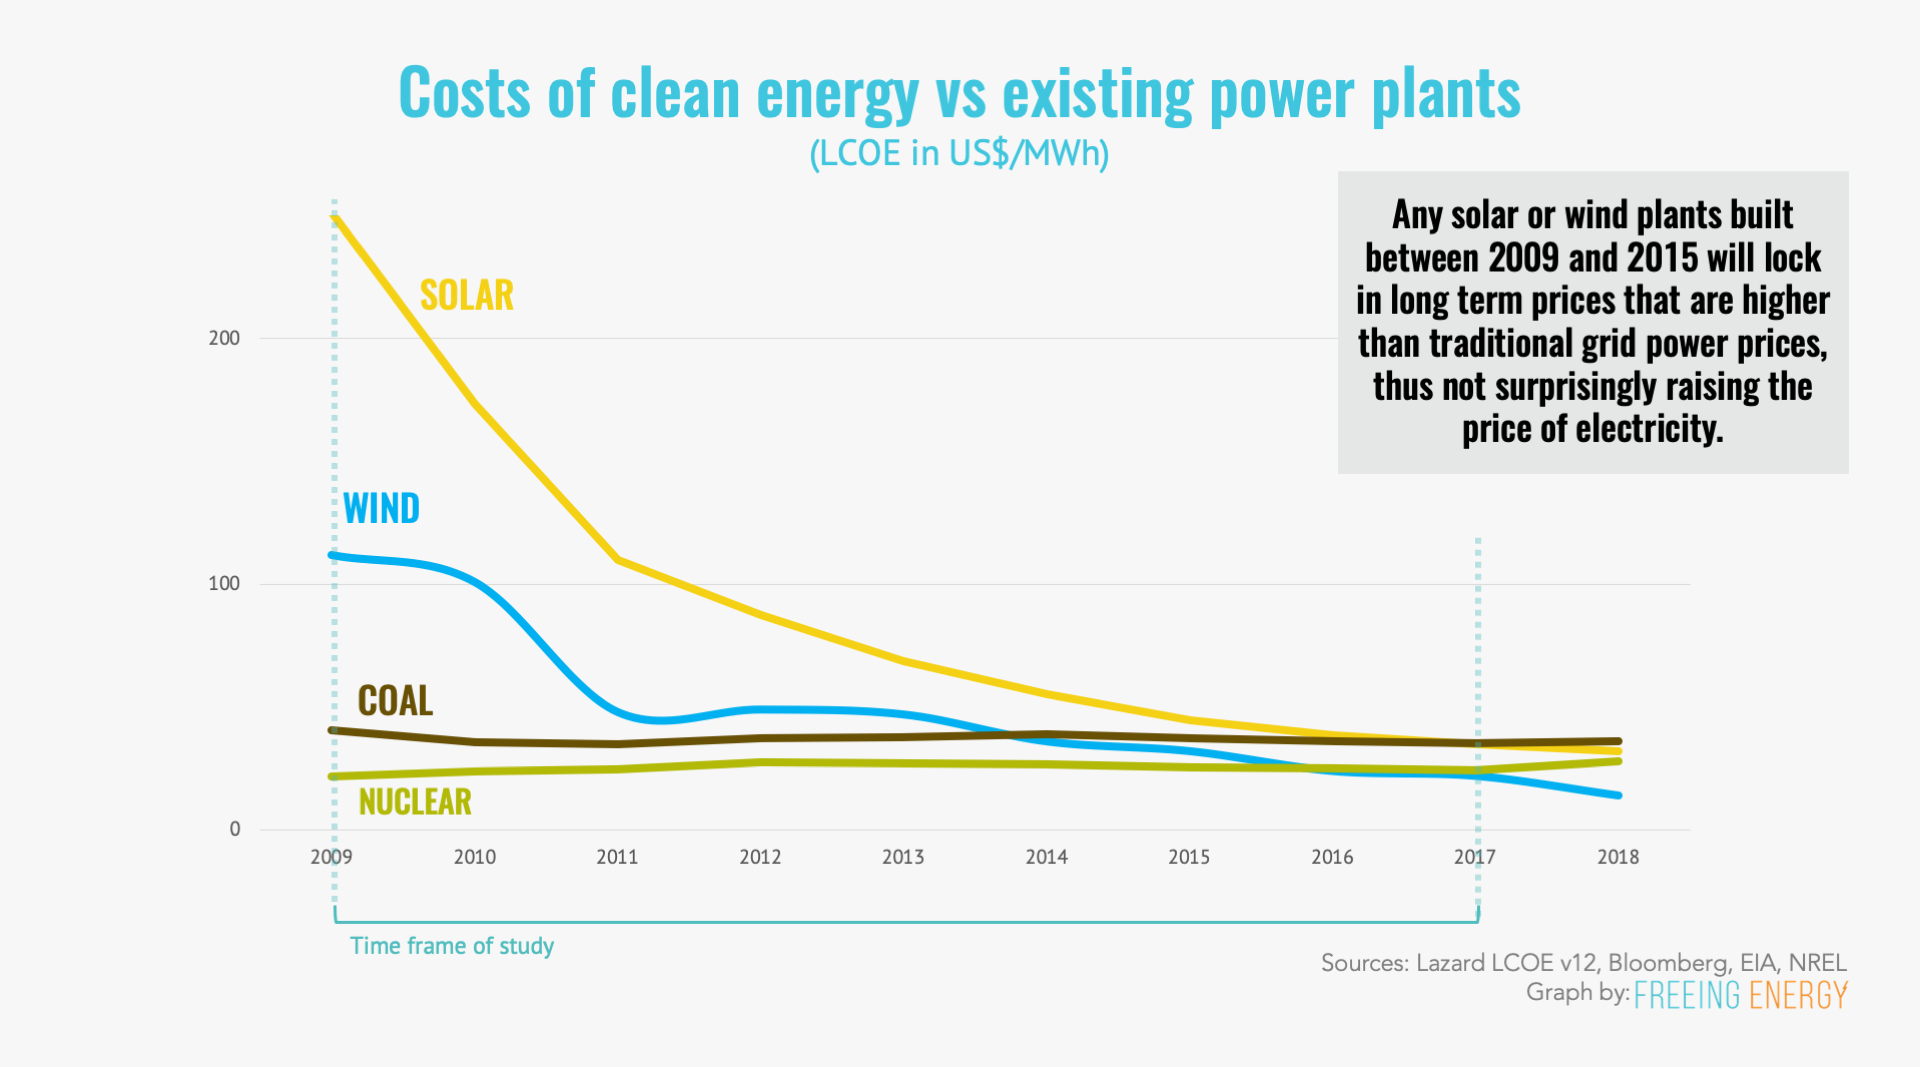
These studies all conclude that future electricity prices will increase as renewable penetration goes up. Here’s the problem. They based their conclusions on mostly pre-2015 prices, back when solar and wind were more expensive than coal, nuclear, and natural gas. It’s like concluding that Netflix will be too expensive by analyzing the cost of 1990’s style dial-up modems. The real question, which these studies don’t address, is what happens when the clean energy resources are less expensive, as wind and solar have been since 2016. Wind wasn’t cost competitive until 2011 and solar only became so in 2016. You can see just how substantial the change in the cost of clean energy is from the graph below1.
What else can drive up electricity prices?
Electricity pricing is incredibly complex so the best any of these studies do is point out correlated trends: electricity prices rose in places around the same time that renewables were more aggressively adopted. It’s like concluding roosters make the sun rise because someone observed them crowing just before the day started. While it’s possible renewable adoption drove up electricity prices, it’s also possible that rising electricity prices prompted utilities to add cheaper renewables. The fact is that there are many factors affecting electricity prices.
- OVER-FORECASTING. Utilities consistently over-forecast growth, and contract new power plants to provide it. Yet, year after year, their forecasts prove optimistic and they have to spread the costs of the new, now unneeded plants over a fixed number of customers, usually by adding fees or raising the kilowatt hour rate. For example, residents served by Georgia Power pay a 10% surcharge on every bill for a “Nuclear Construction Cost Recovery” to help pay for a new nuclear plant, even as the state’s electricity demand has dropped over the last decade.
- STRANDED ASSETS. Legacy coal and nuclear plants whose electricity is no longer cost-competitive still have to pay back their financing. With no revenue, these plants lose money and utilities have to charge customers more to cover the losses.
- PEAKER PLANTS. Whenever there is a surge in demand for electricity, like a particularly hot day prompting everyone to crank up the air conditioning, grid operators often have to spin up expensive “peaker plants” to meet the need. This is like calling a more expensive Uber if you miss the subway to work.
The intermittency of solar and wind may well contribute to the second and third reasons so let’s take a deeper look. One study says assets become stranded due to solar and wind — “In mandating an increase in renewable power, baseload generation is prematurely displaced, which imposes costs on ratepayers and owners of capital.” OK. But between 2010 and 2018, solar and wind increased from 2.3% to 8.2% of the grid mix but natural gas, an even cheaper option at the time, grew from 23.9% to 35.1%, accounting for a much larger portion of any stranded assets. According to a 2017 Department of Energy report, “The biggest contributor to coal and nuclear plant retirements has been the advantaged economics of natural gas-fired generation.”2
Solar and wind may have contributed to stranded assets but they weren’t the main culprit.
What about the peaker plants? These expensive plants have been a part of the grid long before renewables, but the increased adoption of unpredictable solar wind is increasing the reliance on peaker plants. Fortunately, improved weather forecasting and deeper experience with a more dynamic grid will lead to fewer surprises and better balancing across types of plants. For example, wind and solar are often strongest at different times – coordinating their usage can greatly reduce the impact of the intermittency of either one. And batteries are quickly coming to the rescue. As their prices plummet, they offer the single best counter-balance to intermittency. The CEO of utility giant, Next Era, Jim Robo said,
“Post-2020, there may never be another peaker built in the United States — very likely you’ll be just building energy storage instead.”
A widely publicized (and massive) US$66 million Tesla battery installation in Australia has been so beneficial to the grid it will pay for itself in under 2 years.
The Freeing Energy perspective on intermittency
To understand the challenges and the cost of renewable intermittency, we need to stop looking into the past when solar and wind were so expensive. Instead, let’s look at the costs today, and into the future, as the cost of solar, wind, and batteries will continue their amazing decline. It is no doubt easier for utilities to slow roll or even avoid intermittent renewables but public sentiment toward clean energy, not to mention lower costs, make it imperative for utilities to master the challenges today.
After a century of fine-tuning dispatchable grids, utilities have to re-learn grid management in a far more dynamic environment. There is no doubt they will eventually master it and today’s intermittency challenges will fade into history. In fact, places like Texas, Oklahoma, Hawaii, Scotland, and Germany are starting to experience periods when solar and wind account for more than 50% of the electricity on their grids, all without widespread blackouts or other grid failures.
Bruce Rew, Vice President of Operations for the Southwest Power Pool (SPP), a grid operator serving the mid-west US, put this nicely into perspective:
“Ten years ago, we thought hitting even a 25 percent wind-penetration level would be extremely challenging, and any more than that would pose serious threats to reliability. Since then, we’ve gained experience and implemented new policies and procedures. Now we have the ability to reliably manage greater than 50 percent wind penetration. It’s not even our ceiling. We continue to study even higher levels of renewable, variable generation as part of our plans to maintain a reliable and economic grid of the future.”
![]()
Deeper read – University of Chicago EPIC’s RPS study
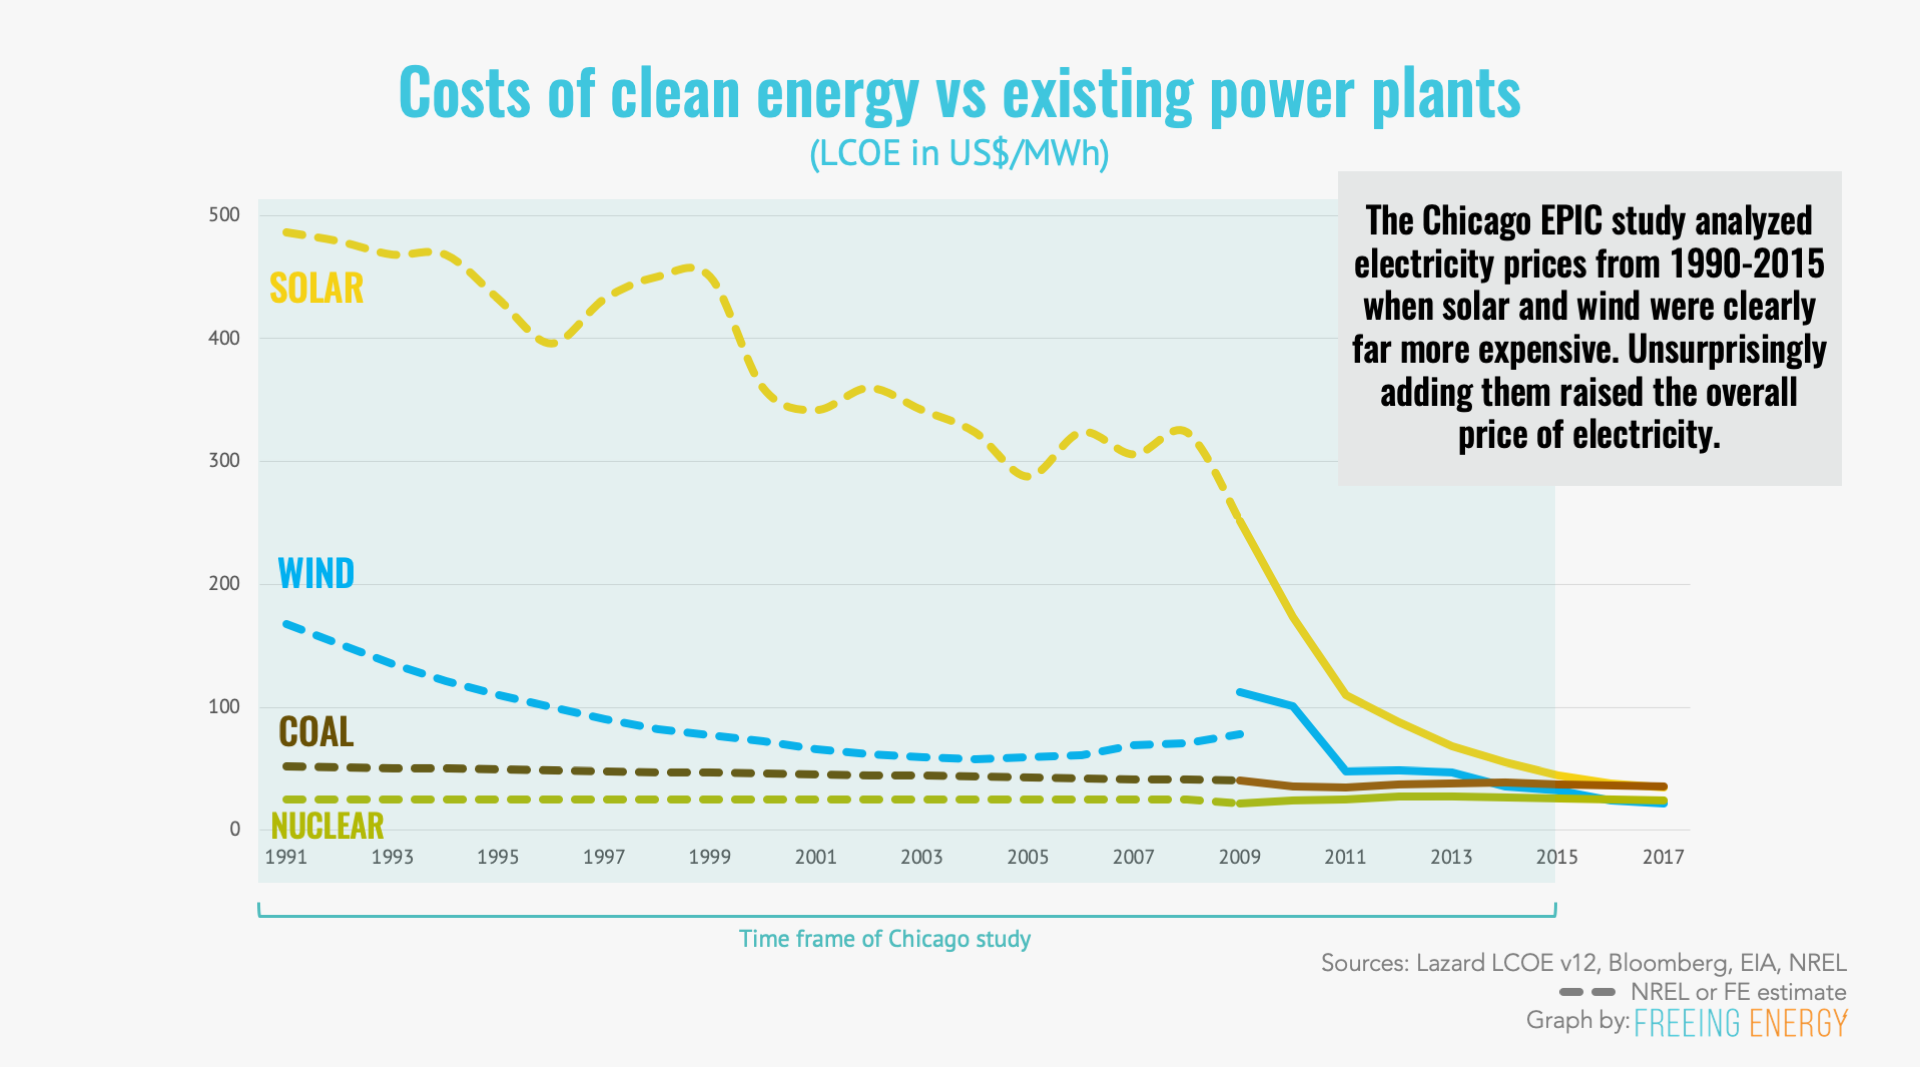
A recent academic research study out of Energy Policy Institute at the University of Chicago found that states with policy-driven renewable energy commitments saw their electricity prices rise faster than states without such policies. Often called Renewable Portfolio Standards or RPSs, these state-wide laws are usually created out of concern for greenhouse gas emissions as each state tries to do its part to limit them in transportation, buildings, and electricity generation. From the study:
The study finds that RPS programs significantly increase average retail electricity prices, with prices increasing by 11 percent (1.3 cents per kWh) seven years after the policy’s passage into law and 17 percent (2 cents per kWh) twelve years afterward.
It later explains that by “increasing the share of renewable generation, the states with an RPS policy saved 95 to 175 million tons of carbon emissions seven years after the start of the programs” which almost certainly helped achieved those states’ objectives. But the researchers warn “these reduced emissions came at a high cost.” So, are these conclusions correct? Does aggressive adoption of renewables correlate with increased electricity prices? The study is thorough and has been reviewed by many other research groups so it’s hard to argue with the math. That is except for one key thing — this study analyzed electricity prices and policies from 1990 to 2015. During that time, the price of electricity from solar and wind was unquestionably more expensive than coal, nuclear, and natural gas, by a lot. Consider what it cost to generate a kilowatt hour from solar over the years in the study (the leveled cost of electricity or LCOE):
Deeper Reading – electricity price increases in select US states
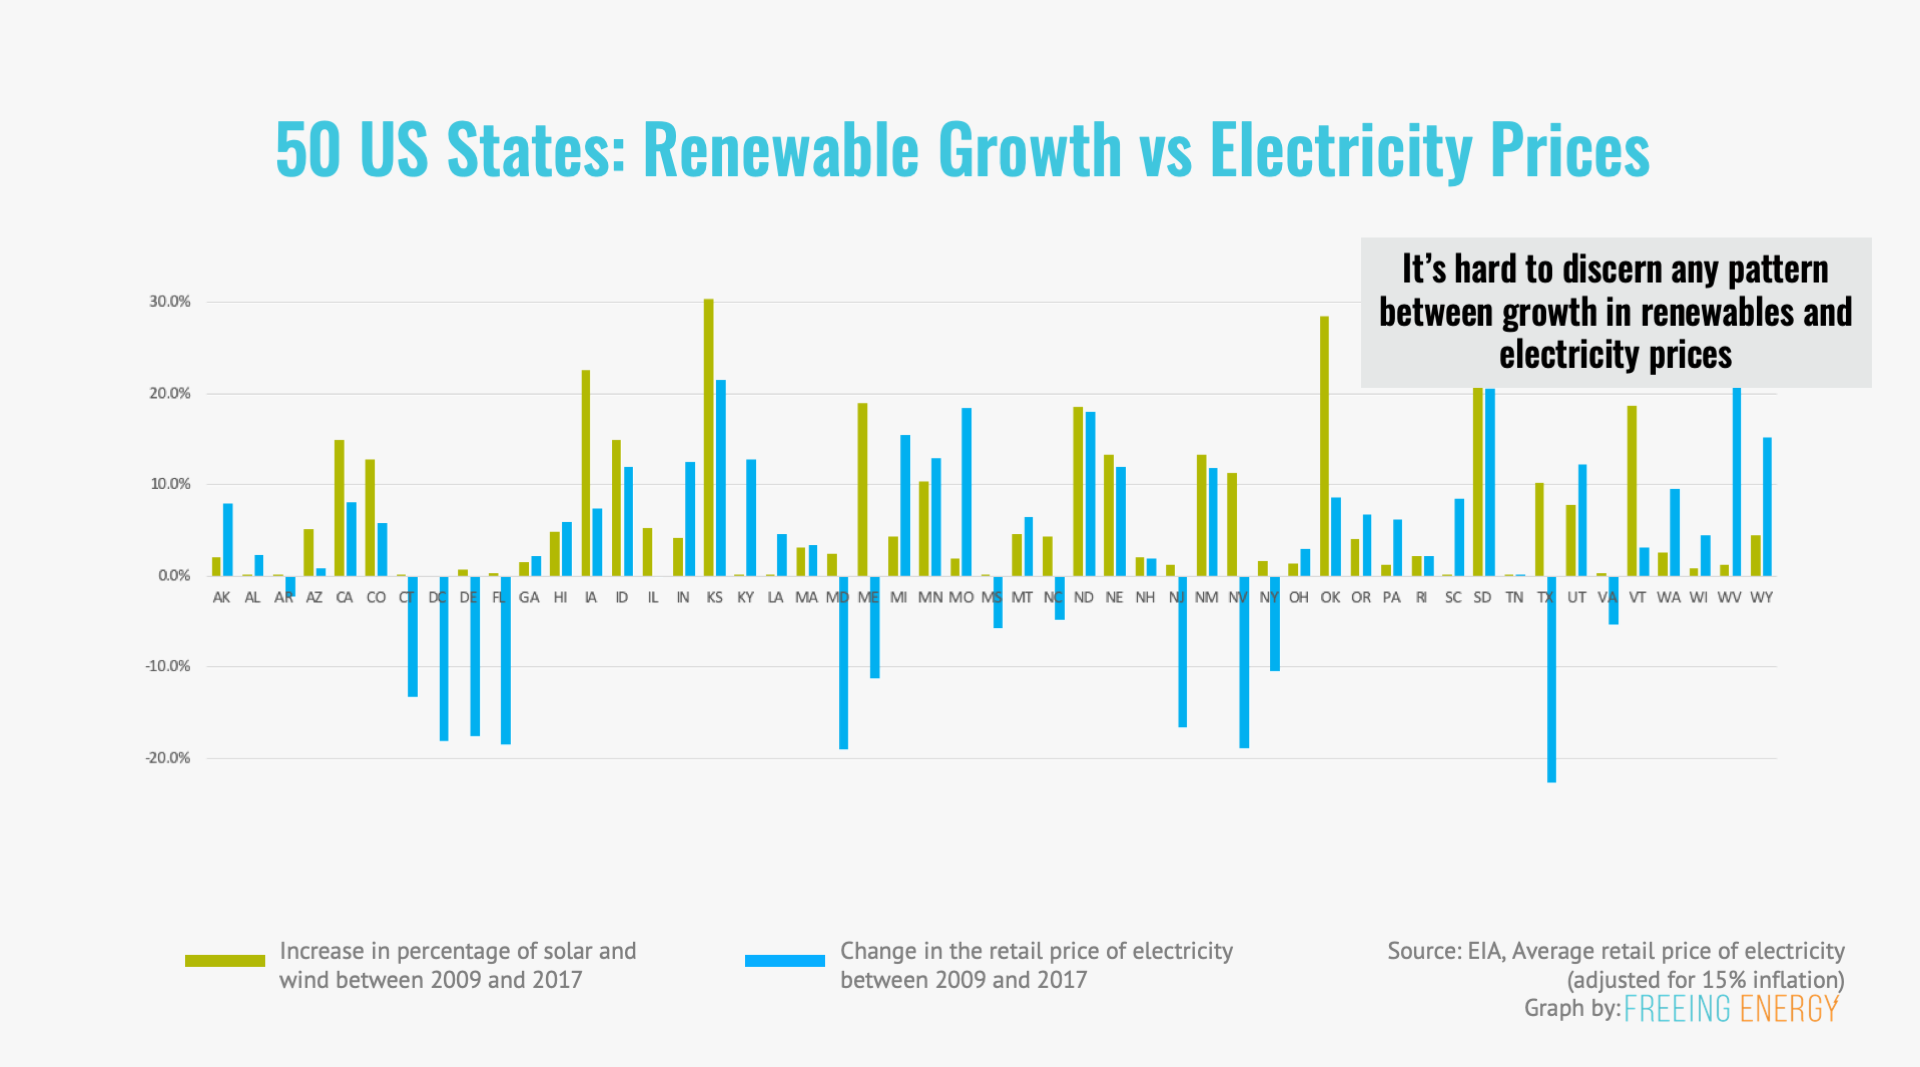
One widely cited analyst argues that Kansas, Iowa, Oklahoma, and North and South Dakota all saw electricity prices increase over 2009 to 2017 by more than 10% as their use of solar and wind increased by 10% or more. There are two problems with this. First, the analysis fails to take into account inflation which made everything in the US 15% more expensive over the same period. Second, those particular states are cherry-picked examples. Across the same 8 years, states like Maine, Nevada, and Texas saw their use of solar and wind go up substantially yet their electricity prices remained steady or even declined, even without adjusting for inflation3.
Deeper read – the impact of Germany’s Energiewende
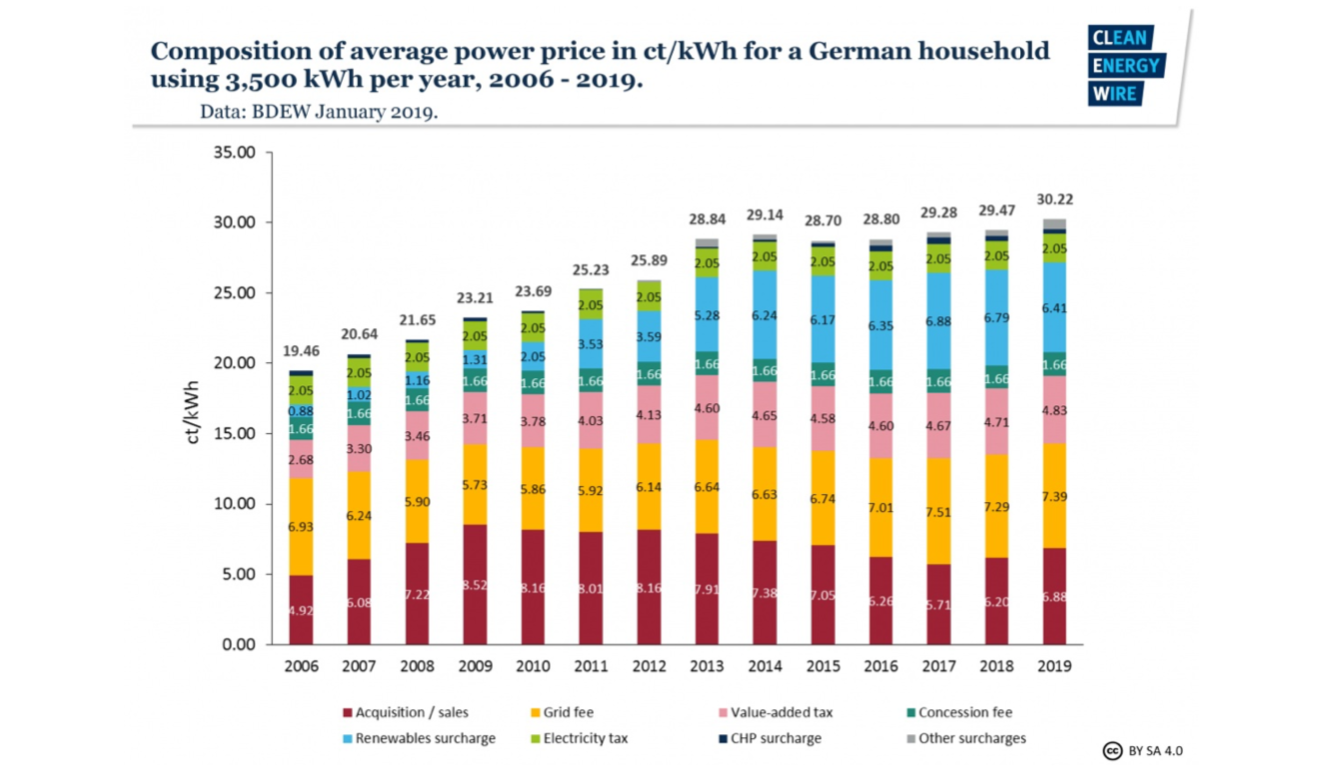
What about Germany, one of the earliest and most aggressive adopters of solar and wind? Their residential electricity prices have increased by more than 50% since 2006. The key word here is “earliest.” It’s like buying a house when the market is at its peak. As costs come down, you are stuck with painful mortgage payments and there is no one interested in buying you out. The largest part of that increase is a residential surcharge called the EEG which is directly used to pay for rooftop solar and other local energy projects. In fact, the real cost of electricity in Germany, as measured by the wholesale market, has actually dropped from €61.25 in 2006 down to €36.99 in 2019.
- Myths – Solar.xlsx, Freeing Energy, tab smy.3 [↩]
- “Staff Report to the Secretary on
Electricity Markets and Reliability,” US Department of Energy, August 2017, page 13 [↩] - Myths – Solar.xlsx, Freeing Energy, tab 4 [↩]

6 Responses
Seems like again in this case, past performance isn’t a predictor of future results…..
The ongoing change in current economics and the awareness of past analysis time periods were very helpful to point out!
Do those studies take into consideration the environmental impact of non renewable energy sources?, I mean, burning coal or gas could be cheaper but what about with the CO2 emsissions? What about other gases (sulfur dioxide, etc.) and acid rain impacts?
What about radioactive materials to be buried? What happens to those zones in the nearby?
If we consider these all when comparing with solar and wind then the conclusion is right, if not, we are cheating ourselves…don´t you agree?
One of the studies acknowledged the benefit of reducing green house gases and pollution but didn’t factor in any economic analysis. All these studies are purely economic. Fortunately, solar and wind are now cheaper than fossil fuels in most situations, even if you don’t take into downstream environmental and health costs.
On nuclear, the management of radioactive waste is actually pretty safe and, to my knowledge, there have not been any reports in the US of nuclear waste getting into the environment. Of course, the bigger question is whether we can maintain that track record for thousands of years as those nuclear materials slowly lose their toxicity.
I’m impressed… Studies that show how the energy companies are mailing their customers with the cost of construction to preserve profitability and blaming it on lawmakers… Who would have imagined that??
Intermittency cost has nothing to do with the investment cost of solar and wind turbine. It is due to fact the utility must maintain the security of supply and must compensate the lost of power with power plant with high fuel cost…(the peakers).
Thanks