| Type | CO2 | Methane (CO2e) | SO2 | NOx |
|---|---|---|---|---|
| Coal | 2,100,000 | 350,000 | 3,900 | 1,600 |
| Natural gas | 900,000 | 540,000 | 5 | 2,100 |
| Biomass | 270,0000 | na | 540 | 3,300 |
| Nuclear | 0 | 0 | 0 | 0 |
| Solar | 0 | 0 | 0 | 0 |
| Wind | 0 | 0 | 0 | 0 |
| Geothermal | 0 | 0 | 0 | 0 |
| Hydro | 0 | 0 | 0 | 0 |
To download this graph and see it yourself, click on the link below:
Comparison of emissions from various power plants (pdf)
To see the original source links and calculations, click below:
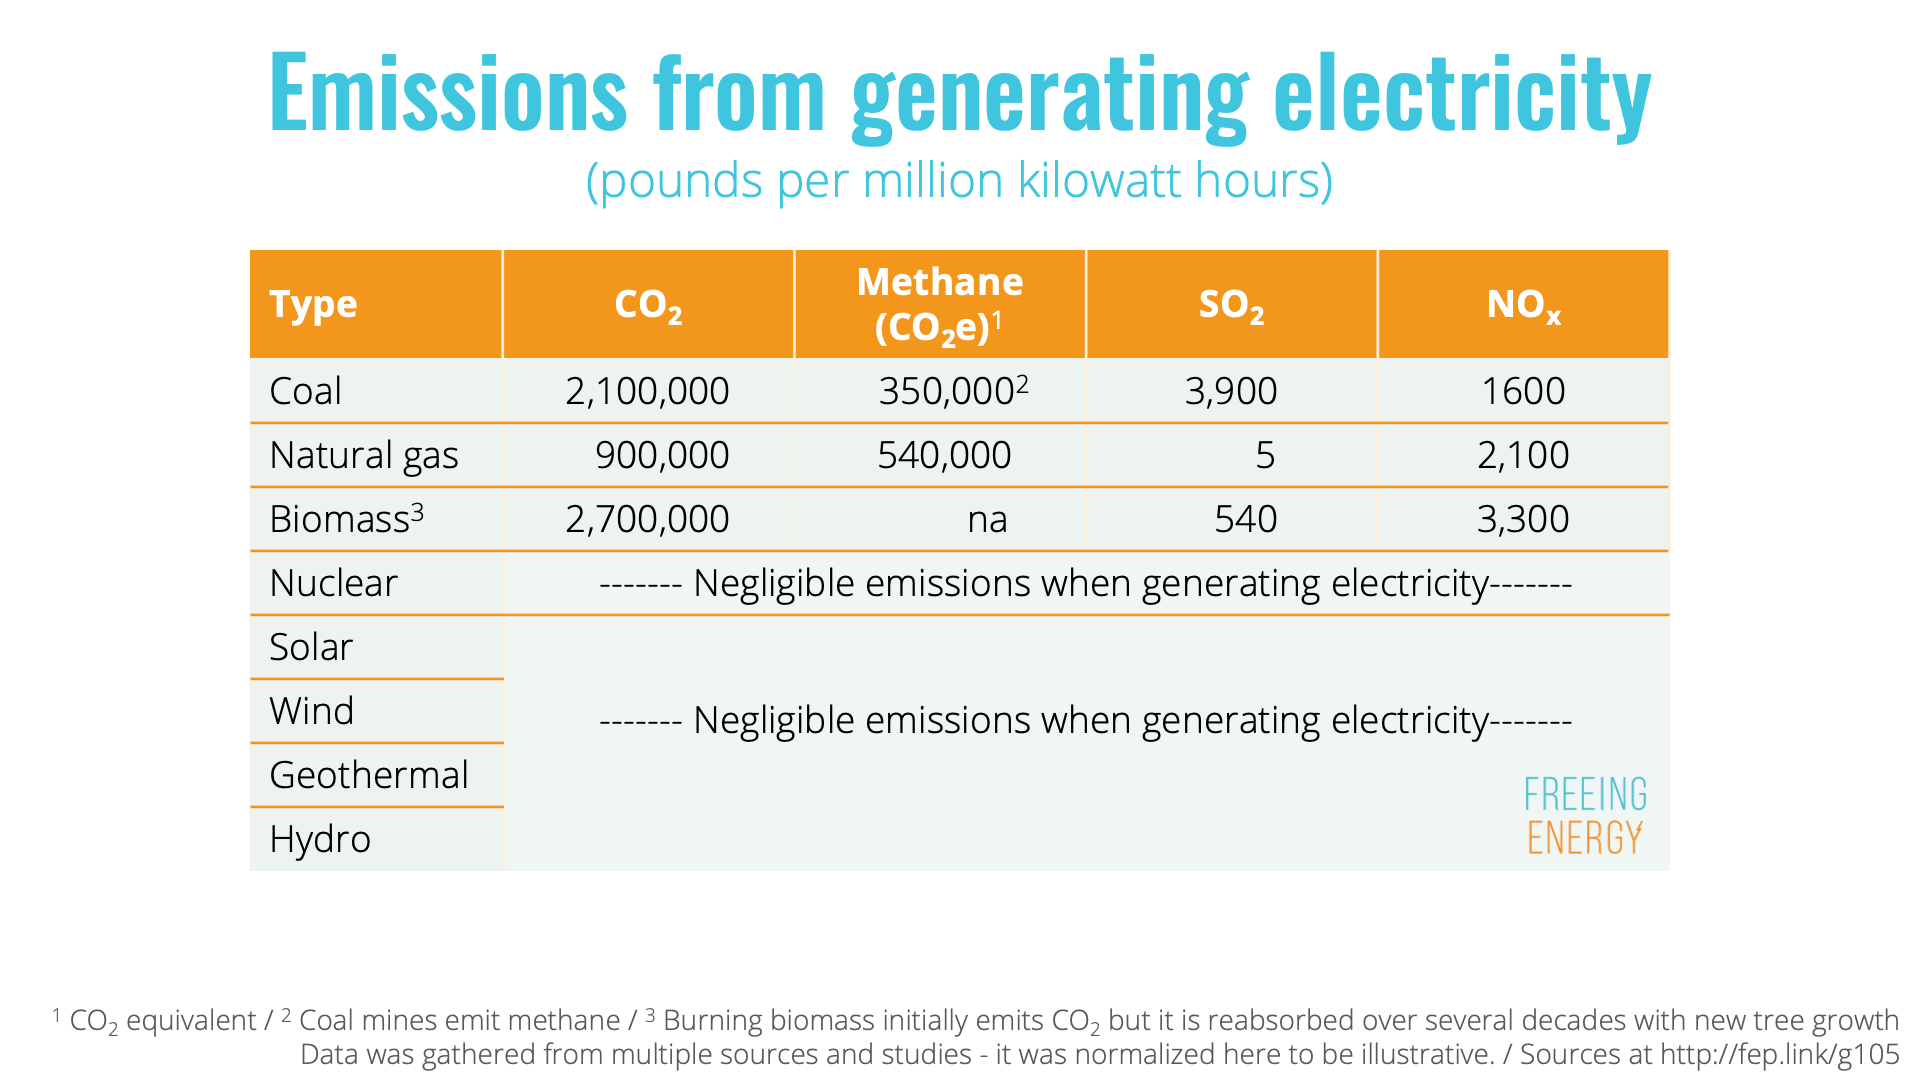
How much CO2, SO2, methane and other emissions come from various power plants?
© 2021 All rights reserved