It’s tough to make predictions, especially about the future.
— Yogi Berra
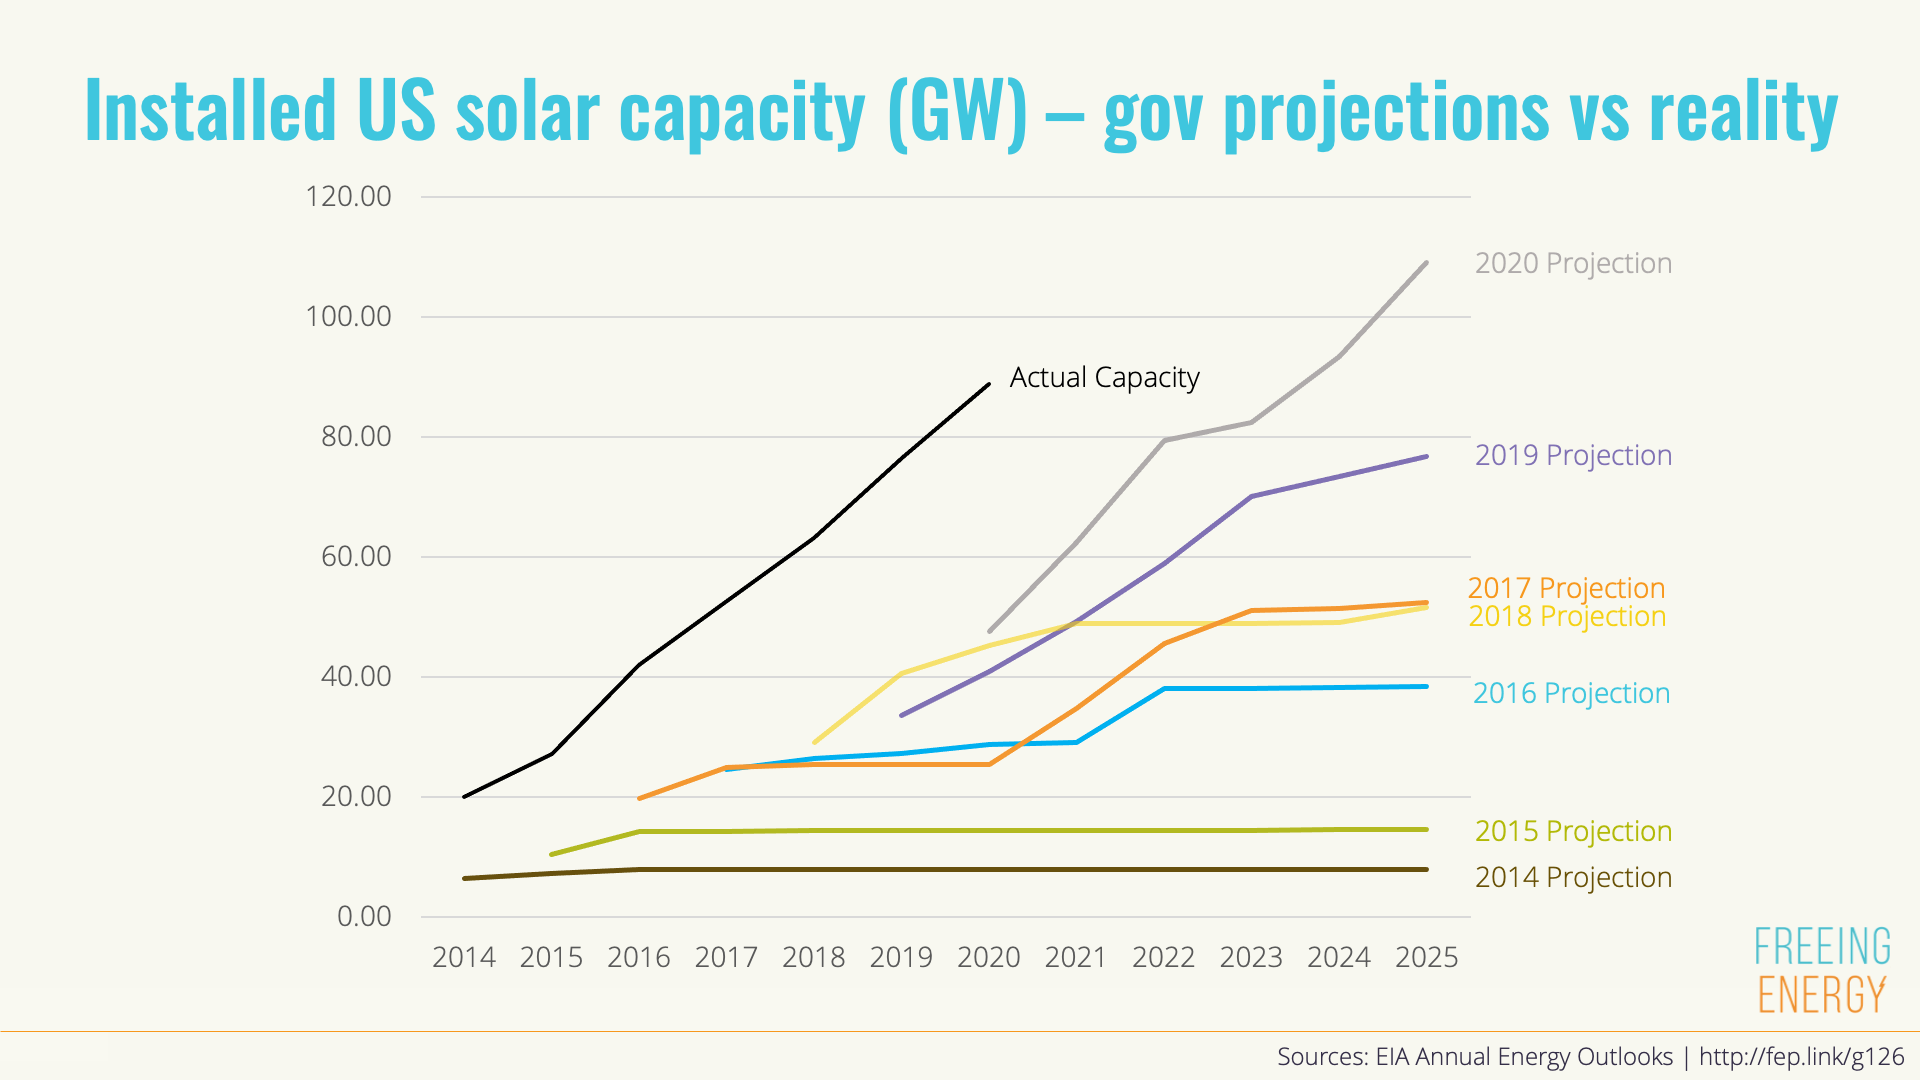
At last week’s Intersolar conference in San Francisco, keynote speaker Tony Seba made a compelling case for near-term disruptions in energy and transportation. In particular, his slide on solar projections really caught my attention. It turns out that government solar predictions have consistently underestimated actual installations for as long as the solar industry has been around.
I did a little sleuthing and found the source of Tony’s slide. A group called Clean Energy Action authored a report in 2016 that first showed a graph of EIA projections versus actual installations. I did a little digging on the EIA site and put together an updated version of this eye-opening graph (below).
What is going on with this graph?
First, let me explain where this information is coming from. The Energy Information Administration (EIA) is the U.S. government department charged with collecting and sharing all kinds of information on energy production and consumption. The EIA generally does a tremendous job and I cite their information throughout my articles. But, when it comes to solar, the EIA has whiffed and whiffed again. In early 2010, the EIA projected solar installations would reach 0.45 gigawatts by 2035. Instead, solar capacity exceeded 1.0 gigawatts by the end of 2011 – twice as much, 25 years sooner than the EIA’s models. As you can see from the graph, the EIA continued making bad projections for years. It wasn’t until 2016 that the EIA really accepted that solar was going to grow.
GET MONTHLY NEWS & ANALYSIS
Unsubscribe anytime. We will never sell your email or spam you.
The EIA was also pessimistic about wind power but their projections proved to be much closer to reality. In 2010, the EIA projected wind power would reach 64 gigawatts by 2017. In reality, wind capacity was a bit larger in that year at 89 gigawatts.
This pessimism about clean energy isn’t necessarily some U.S. conspiracy. The EIA’s international sibling, the International Energy Agency (IEA), has also famously under-projected solar and wind for years as well.
Why doesn’t the EIA make better projections?
The EIA and IEA are famously defensive of their projections. The EIA even put out a white paper in 2016 explaining why their forecasts have been so wrong for so long. In short, they say that they can’t predict changes in government policies that affect adoption and pricing.
While ever-changing policies are likely a part of their pessimistic projections, I think it’s also possible that wind and solar simply break their models. The cost of every other kind of energy is tied to some type of fuel. But, solar and wind aren’t fuels, they are technologies. Costs aren’t driven by mining and pumping and shipping. Instead, costs are built on ingenuity, innovation and massive volumes of scale.
The EIA and IEA are getting better at projecting clean energy capacity. In 2016, the EIA even started including rooftop solar and other local energy solutions in their models. Hopefully, policymakers and investors will soon start getting more accurate data to make critical decisions about our transition to clean energy.


3 Responses
Great material. Any updates? What is 2019 PV cost per watt?
The price of solar has continued to decline at an amazing rate. As of April 2019, the cheapest solar was selling for an astounding 22 cents per watt (0.20 euros per watt). You can check out the latest prices here: https://www.pv-magazine.com/features/investors/module-price-index/