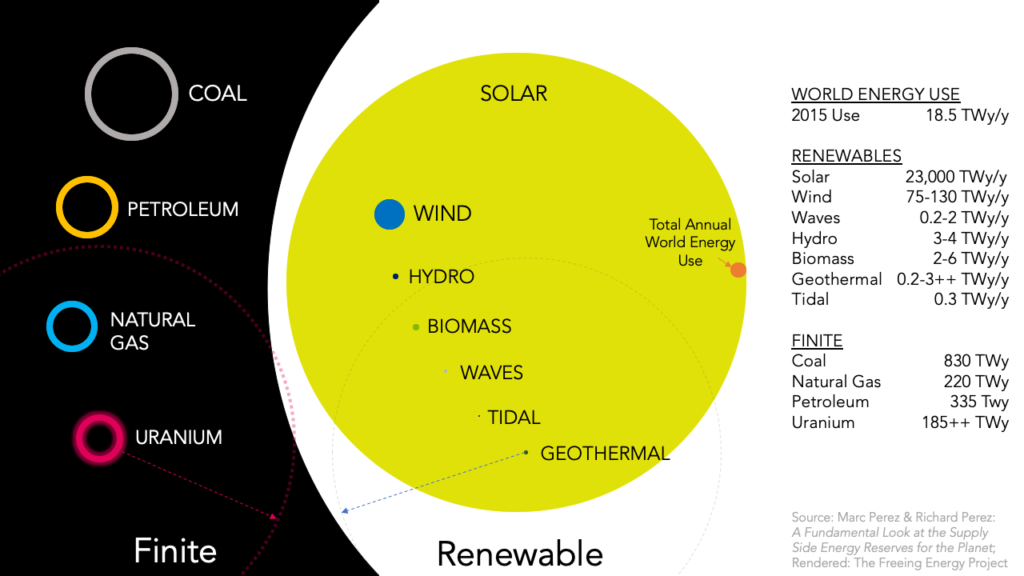
There is so much solar energy hitting the earth’s surface that even a single year of sunshine exceeds all known energy reserves of oil, coal, natural gas and uranium put together.
The energy from the sun dwarfs every other kind of renewable energy, in large part because wind, hydro, biomass, and waves are the direct result of the sun’s light and heat.

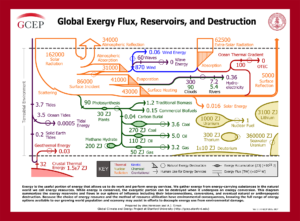
The colossal amount of solar energy relative to every other finite and renewable source has been described by other groups like the Department of Energy((“Solar FAQ“, Jeff Tsao, Nate Lewis, George Crabtree of the US Department of Energy, April 2006)) and Stanford University((“Global Exergy Flux, Reservoirs, and Destruction,” Stanford University’s Global Climate and Energy Project, retrieved July 7, 2019)). But no other work has gotten as much attention as the visualizations by Richard Perez and Marc Perez in their 2015 article, A Fundamental Look At Supply Side Energy Reserves For The Planet. Marc generously shared a slightly revised version of their work for this article. If you’re interested in Marc’s most recent work, check out the awesome interview we had as part of the Freeing Energy podcast series, Can we capture more sunshine and save big on energy storage?.
Let’s take a look at some of the most interesting parts of this diagram.
Solar energy
Solar generates 23,000 terawatt years of energy per year. Believe it or not, these solar energy numbers are conservative — they assume only 35% of sunlight gets through the atmosphere and they only measure sunlight falling on land masses.
How much energy is this? To put it in perspective, your monthly electric bill is measured in kilowatt hours. A kilowatt year is 8,760 times more energy (1 kilowatthour x 365 days x 24 hours in a day). A terawatt hour is a billion kilowatt hours. So, together, a terawatt year is 8.760 trillion times more energy than a standard kilowatt hour.
Wind energy
Wind generates 75 to 130 terawatt years per year of energy, a surprisingly small fraction of solar energy. Remember that all wind results from the convection currents created by the sun heating the atmosphere. Stanford’s research shows that 19%((Energy Reserves.xls, er.1, Freeing Energy, July 7, 2019)) of the sun’s energy from space is absorbed in the atmosphere and 2.8%((Energy Reserves.xls, er.2, Freeing Energy, July 7, 2019)) of that results in wind energy.
GET MONTHLY NEWS & ANALYSIS
Unsubscribe anytime. We will never sell your email or spam you.
Geothermal energy
There is 0.2 to 3.0 terawatt years per year of easily usable geothermal energy. There is a vastly larger amount of geothermal energy just below the earth’s surface but almost all of it is what scientists call “low-grade heat,” uneconomical to use for anything more than heating buildings. A recent report by the US Department of Energy called “GeoVision: Harnessing the Heat Beneath Our Feet((”GeoVision: Harnessing the Heat Beneath Our Feet,” US Department of Energy’s (DOE) Geothermal Technologies Office (GTO), June, 2019))” says extensive R&D could drive geothermal as high as 60 gigawatts by 2050, a small fraction of the potential 3 TW (3,000 GW’s) mentioned in the chart above. However, if scientists find a way to transform low-grade heat into electricity, the much wider dotted circle on this graph becomes possible.
Biomass energy
Only 0.1%((Energy Reserves.xls, er.3, Freeing Energy, July 7, 2019)) of solar energy reaching earth’s surface is used in photosynthesis, the essential energy conversion for all living things. Transforming this captured energy into anything other than food is very inefficient. And, growing or harvesting biomass, like corn for ethanol, or wood pellets for power plants is rarely carbon neutral and usually consumes large amounts of water, fertilizer, and oil for transportation.
Uranium energy reserves
For me, the most surprising data point from this chart was the relatively low potential energy from the world’s uranium reserves. The Nuclear Energy Association estimates((“Uranium 2018 Resources, Production and Demand,” A Joint Report by the Nuclear Energy Agency and the International Atomic Energy Agency, Page 15 )) a total of 15 million tons((“Cost Nuclear (nu).xls, nu.2, Freeing Energy)) identified and potential uranium reserves on earth. The World Nuclear Association estimates total uranium reserves will last 90 years((“Supply of Uranium,” World Nuclear Association, retrieved July 7, 2019)). Given all this, it’s not surprising that total reserves are smaller than expected. Of course, new technologies that can make better use of the uranium potentially increase the reserves 30-50 times, but even then, it’s still dwarfed by solar’s annual production.
The Freeing Energy perspective
Available energy reserves are a fascinating lens for understanding the potential for any single source of energy. But, in the end, the adoption of one type of energy over another is determined by relative costs. Again, solar comes out on top here — solar is increasingly the least expensive way to generate electricity. The cost of solar has dropped 300-times over the last 40 years and it will continue to decline for years to come, making its cost advantage larger and larger. Batteries are on a similar cost decline and, together with solar, they provide unlimited access to the cheapest and most widely available source of energy to power our plant – solar energy.
Additional reading
- The revised 2015 visualizations by Marc and David Perez: A Fundamental Look At Supply Side Energy Reserves For The Planet
- Wikipedia’s great article, Solar Energy
- Stanford’s Exergy visualization


One Response
This is a spectacular result! I commend the articles.
A slight reservation: Geothermal is greatly underestimated. High temperature geothermal doesn’t come from the sun, it is, instead, due to nuclear fusion and fission at the earth’s core. The part that we see is volcanoes, but most of it is the cause of ocean floor spreading, due to dozens of smaller undersea volcanoes. There is a great opportunity for thermal energy extraction, between high temperature molten rock, and the cool, thermally conductive ocean.